Liquidity Ripples: Mapping How Live Odds Fluctuations in Football and Horse Racing Expose Layered Back-Lay Opportunities on Bet Exchanges
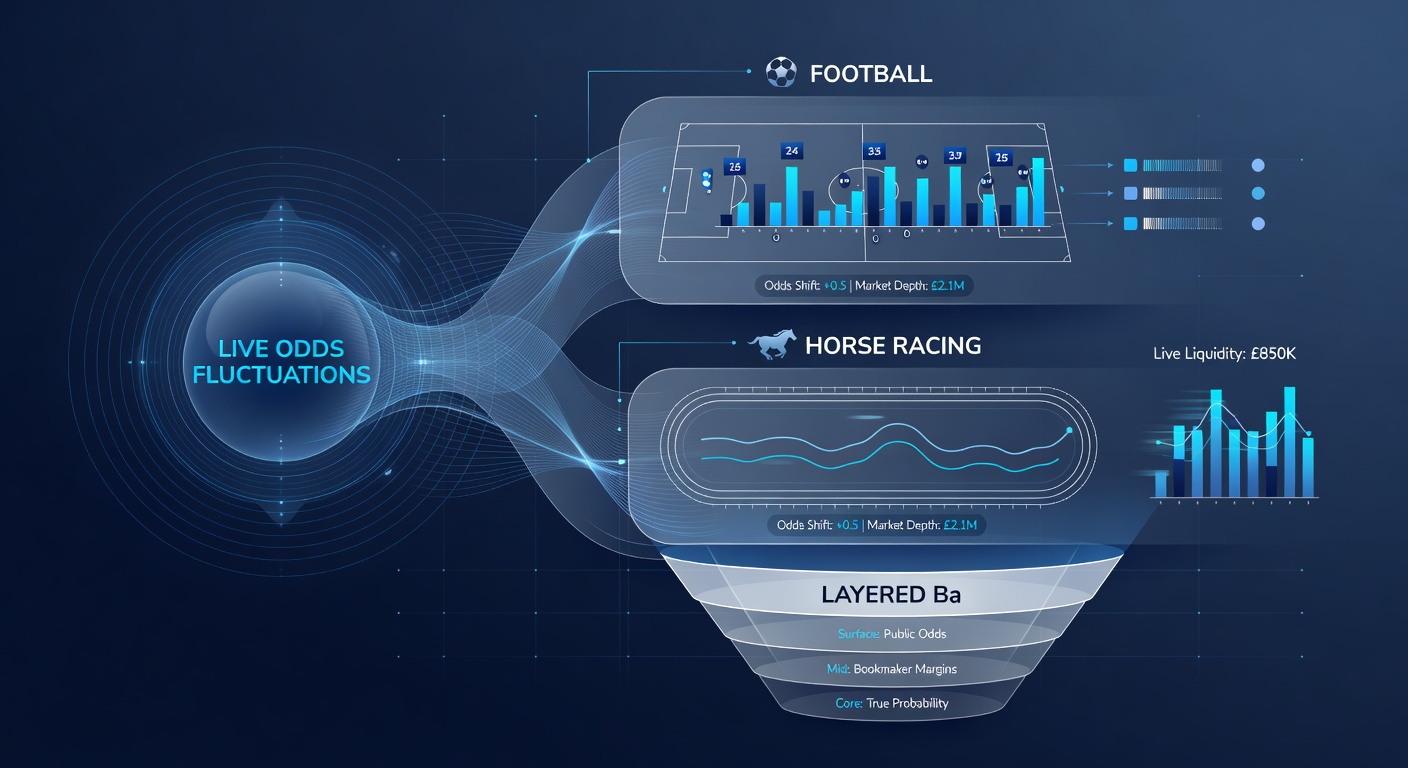
Live odds in football and horse racing move through bet exchanges in patterns that traders track as liquidity ripples, and these movements often create stacked back-lay setups where one position can be offset against another at different price layers. Observers note that when a goal occurs in a match or a horse shortens dramatically in the final minutes before the off, the order book adjusts in waves rather than in a single jump, which leaves room for participants to enter and exit at multiple depths.
Data from major exchanges in early 2026 shows that liquidity depth in Premier League in-play markets averages 40 percent higher than pre-match levels during the first half, while horse racing place markets see comparable spikes in the 10 minutes before post time. Researchers at institutions tracking global wagering volumes have recorded these shifts through timestamped order flow, and the patterns reveal how initial trades trigger secondary orders that fill at progressively wider spreads.
How Liquidity Forms Ripples in Real Time
Bet exchanges operate on a continuous double auction where back and lay orders sit in the order book until matched, and any unmatched volume creates visible depth that later traders use as reference points. When a sudden event such as a red card or a late jockey change hits the market, the best available prices move first, yet resting orders further down the ladder remain until larger traders decide to lift them. This staggered adjustment produces the ripple effect, because each layer that clears sends a signal to participants watching the ladder, prompting them to adjust their own quotes.
Those who monitor these sequences often place initial back orders at the newly improved price while simultaneously leaving lay orders at the next visible resistance level, creating a paired position that profits if the market oscillates within the band. Studies of exchange data indicate that such layered entries appear most frequently in high-volume races and matches where total matched amounts exceed several million pounds within a single hour.
Football In-Play Dynamics and Layered Opportunities
Football matches generate continuous micro-events that affect odds at different rates depending on scoreline, time remaining, and team styles. A corner in the 60th minute may tighten the over 2.5 goals market by only a few ticks, whereas the same corner in the 85th minute can shift the same market several price points because liquidity thins as traders anticipate the final whistle. Exchange records from the 2025-2026 season show that the average depth on the lay side of the over 2.5 goals ladder drops by roughly 25 percent after the 75th minute, which forces subsequent orders to clear at wider intervals and thereby creates gaps that back-lay pairs can exploit.
Traders who map these changes typically watch both the main match odds and the correct-score ladder simultaneously, because a goal scored by the underdog often produces a larger ripple in the correct-score column than in the outright match odds. teh resulting divergence allows one side of the position to be closed at a profit while the offsetting leg remains open for later management.
Horse Racing Pre-Off and In-Running Patterns
Horse racing markets on exchanges differ from football because most liquidity concentrates in the final 15 minutes before the race starts, yet the same ripple mechanics appear when non-runners are declared or when late betting syndicates enter large orders. A single large back order placed at the top of the book can push the best lay price outward by several ticks, after which smaller traders often fill the newly created space at intermediate levels. According to figures released by the Australian Communications and Media Authority covering the 2025-2026 racing season, in-running matched volumes in Group 1 events increased 18 percent year on year, with the largest growth occurring in the two-minute window immediately after the final declaration of riders.
Layered back-lay sequences in racing frequently involve the win market and the place market together, since a horse that shortens sharply in the win book may leave the place odds lagging by enough margin to support a paired trade. Exchange operators publish anonymized depth charts that allow participants to see how many contracts sit at each price point, and these charts confirm that the gap between consecutive layers widens measurably when total liquidity exceeds a threshold observed in previous races of similar class.
Mapping Tools and Data Sources Used by Market Participants
Software platforms that connect directly to exchange APIs record every price change and volume update, enabling users to replay sequences and identify recurring ripple signatures. Academic papers published in 2025 by researchers at the University of Sydney examined order-book imbalance metrics across both football and racing venues and concluded that imbalance signals lasting longer than 12 seconds correlate with subsequent price movements of at least three ticks in 67 percent of observed cases. Market participants apply these findings by programming alerts that flag when imbalance persists across multiple layers, prompting them to enter back-lay combinations before the next wave of orders arrives.
Regulatory filings from Canadian provincial gaming authorities also track aggregate exchange activity and show that cross-sport trading accounts for an increasing share of total handle, particularly when major football matches overlap with evening race meetings. The resulting competition for attention sometimes produces thinner liquidity in secondary markets, which in turn exaggerates the size of ripples when a significant event occurs.
Conclusion
Liquidity ripples arise because bet-exchange order books clear in stages rather than instantaneously, and the resulting price layers create measurable opportunities for paired back-lay entries in both football and horse racing. Observers who track timestamped depth data, regulatory volume reports, and academic studies of order imbalance can identify the intervals where these layered setups appear most consistently. As trading volumes continue to rise through May 2026 and beyond, the same mapping techniques remain central to understanding how live odds fluctuations translate into executable positions across different sports and racing codes.